Generating volumetrics report
The Generate Report form (Model > Volumetrics) contains options that allow you to control the content and presentation of your Volumetrics Report, as well as its format (e.g., Pivot Table in Excel).
To create a volumetrics report
- From the Case drop-down list, select the case of interest.
- From the following options, select what information to show on the report and how you want this information to be presented.
- Click Apply to generate the report and keep the form open, or click OK to generate the report and close the form.
Export report to Excel Select the 'Export report to Excel' checkbox to export the results from the volumetric calculation in an Excel™ spreadsheet.
Folder Click on the ellipsis button  to select a folder in which you can store the spreadsheet with the results.
The created Excel™ file will have three worksheets:
Pivot table This sheet includes extra rows for subtotal volumes and the grand total volume. See the image below for an example.
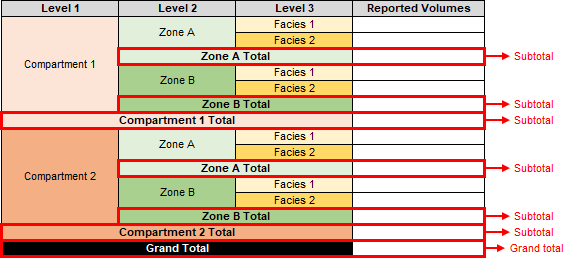
An example illustrating the format of the Pivot table, which includes extra rows for subtotal volumes and the grand total volume. click to enlarge
Database This sheet includes reported volumes per region, and per realization.
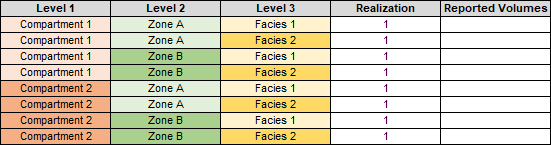
An example illustrating the format of the Database sheet. click to enlarge
Standard report This sheet displays the Volumetrics Report, which is shown in the main view area.
Grouping
By regions Create one table, where volumes are reported per region.
By fluid legs and regions Create separate tables per fluid leg. For each fluid leg, volumes are reported per region.
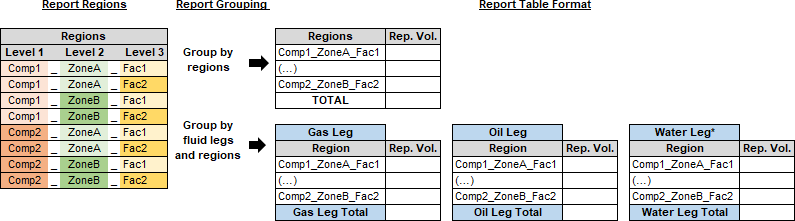
You can create either one table (Group by regions) or multiple tables per fluid leg (Group by fluid legs and regions). click to enlarge
*Water Leg is reported only if 'Total grid' is selected in the Volumes section, explained below. click to enlarge
Volume Reporting
At conditions
Surface Select to report the volumes at surface conditions.
An example of reported volumes when 'Surface' is selected. click to enlarge
Surface and reservoir Select to report the volumes at surface conditions and at reservoir conditions.
Volumes
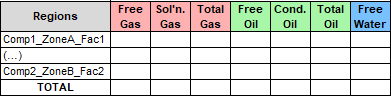
Total grid (BV, NV, PV) Select in combination with the volume reporting option Surface and reservoir, to report Bulk Volume, Net Volume and Pore Volume, which take into account the volumes of the entire grid.
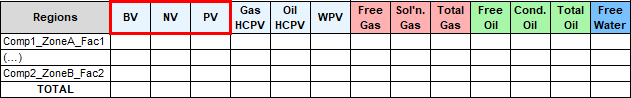
An example of Volumetrics Report table when 'Surface and reservoir' is selected in combination with 'Total grid'. click to enlarge
Hydrocarbon leg (GRV, NRV, NPV) Select in combination with the volume reporting option Surface and reservoir, to report Gross Rock Volume, Net Rock Volume, Net Pore Volume, which take into account the volumes above the free water level.
Report only regions with hydrocarbons Select this checkbox to exclude the regions without hydrocarbons.
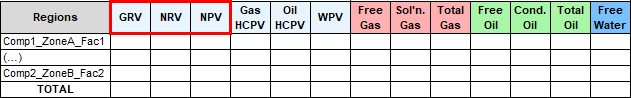
An example of Volumetrics Report table when 'Surface and reservoir' is selected in combination with 'Hydrocarbon leg'. click to enlarge
Units and Formats Set the units and number formats (i.e. decimals) for the reported volumes.
Stochastic Parameters Available only when you are calculating volumetrics with properties of multiple realizations.
Distribution type Select the distribution type for the probability reporting: Empiric, Normal, Lognormal or Triangular.
Probabilities Select which probabilities you want to report: P5, P50, P95, or, P10, P50, P90, or P15, P50, P85.
Upon Apply or OK, the Volumetrics Report is generated and displayed in a dedicated view that has the name of your volumetrics case. If the 'Export report to Excel' checkbox is selected, the Excel™ will be automatically launched and show the results of the volumetric calculation in a spreadsheet. The properties that are input to the volumetric calculations will be displayed in the Volumetrics Report under the section 'Data used to calculate volumes'. For an explanation of the terms and abbreviations used in the report, see Reported volumes and totals.
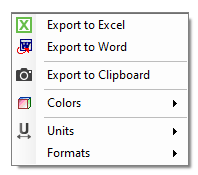
Volumetrics Report context menu click to enlarge
To open the context menu, right-click anywhere in the volumetrics report, which is displayed in the main view area.
There are three options to export the information which is displayed in the volumetrics report:
Export to Excel Export to an Excel™ spreadsheet.
Export to Word Export to a Word™ document.
Export to Clipboard Export to the Windows™ clipboard.
Colors Set the color of headers and rows in the volumetrics report table.
Units Set the unit for the reported volumes (Reservoir unit, STV oil unit, STV gas unit).
Formats Set the number of decimals for the reported volumes (Reservoir format, STV oil format, STV gas format).
Only the volumes within the defined regions are calculated and the Fluid leg definitions and GRV calculations have impact on the volume calculations.

Volumetric calculations for the reported volumes - GRV, NRV and NPV take into account only the volumes above the FWL, whereas BV, NV and PV take into account the entire grid. In any case only the volumes within the defined regions are calculated. See Fluid leg definitions and volume calculations for more details. click to enlarge
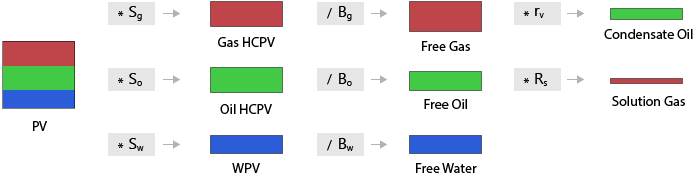
Volumetric calculations for the reported volumes. click to enlarge
The following terms are used to explain the formulas of the reported volumes:
|
Vcell |
Total grid cell volume |
|||
|
Vcellabove FWL* |
Total grid cell volume above FWL |
|||
|
Vcelloil leg* |
Total grid cell volume in oil leg |
|||
|
Vcellgas leg* |
Total grid cell volume in gas leg |
|||
|
ntg |
Net to gross ratio |
|||
|
ɸ |
Porosity |
|||
|
So |
Oil saturation |
|||
|
Sg |
Gas saturation |
|||
|
Rs |
Solution gas-oil ratio |
|||
|
Rv |
Vaporized oil-gas ratio |
|||
|
* Please be aware that the definitions of these volumes depend on the Fluid leg definitions and volume calculations. |
||||
The following volumes are calculated and displayed in the report:
| Abbreviation | Definition | At reservoir conditions | At stock tank (surface) conditions | Formula |
|---|---|---|---|---|
|
BV |
Bulk Volume |
✔ |
[Vcell] |
|
|
NV |
Net Volume |
✔ |
BV * [ntg] |
|
|
PV |
Pore Volume |
✔ |
NV * [ɸ] |
|
|
GRV* |
Gross Rock Volume |
✔ |
[Vcellabove FWL] |
|
|
NRV* |
Net Rock Volume |
✔ |
GRV * [ntg] |
|
|
NPV* |
Net Pore Volume |
✔ |
NRV * [ɸ] |
|
|
Gas HCPV |
Gas Hydrocarbon Pore Volume - Pore volume occupied by gas |
✔ |
PV * [Sg] |
|
|
Oil HCPV |
Oil Hydrocarbon Pore volume - Pore volume occupied by oil |
✔ |
PV * [So] |
|
|
WPV |
Water Pore Volume - Pore volume occupied by water |
✔ |
PV – ( Oil HCPV + Gas HCPV ) |
|
|
Free Oil |
Amount of oil originating from the oil phase in the reservoir |
✔ |
Oil HCPV / [Bo] |
|
|
Condensate Oil |
Amount of oil originating from the gas phase in the reservoir |
✔ |
Free Gas * [Rv] |
|
|
Total Oil |
Total amount of oil in the reservoir |
✔ |
Free Oil + Condensate Oil |
|
|
Free gas |
Amount of gas originating from the gas phase in the reservoir |
✔ |
Gas HCPV / [Bg] |
|
|
Solution Gas |
Amount of gas originating from the oil phase in the reservoir |
✔ |
Free Oil * [Rs] |
|
|
Adsorbed Gas |
Amount of gas that was adsorbed on solid material in the reservoir |
✔ |
BV * [Rock density] * [Adsorbed gas content] |
|
|
Total Gas |
Total amount of gas in the reservoir |
✔ |
Free Gas + Solution Gas + Adsorbed Gas |
|
|
Free Water |
Total amount of water in the reservoir |
✔ |
WPV / [Bw] |
|
|
* Please be aware that the calculations for these volumes depend on the Fluid leg definitions and volume calculations. |
||||
A note on Free Water volume
JewelSuite calculates Free Water volume and this refers to the total amount of water in the reservoir. What this volume actually represents depends on the type of porosity (i.e. effective or total) you use in your volumetric calculations.
Depending on the porosity type you assign in the 3D Grid Properties (model > Volumetrics) step, the following applies:
- If you assign Φeff (effective porosity):
- If you assign Φtotal (total porosity):
Free Water volume (calculated by JewelSuite) = [Mobile Water]+ [Irreducible Water]
Free Water volume (calculated by JewelSuite) = [Free Water] + [Bound Water]
See the formulas and the image below for details on the terminological definitions of free water, bound water and total water volumes:
- [Free Water] = [Mobile Water]+ [Irreducible Water]
- [Total Water] = [Free Water] + [Bound Water]
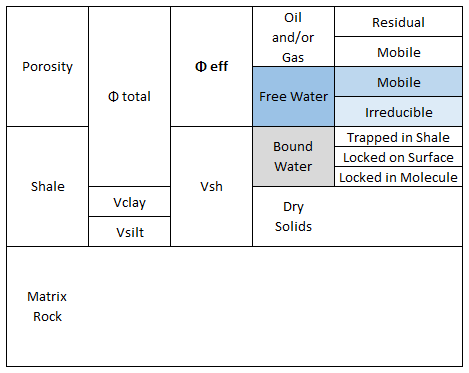
Definitions of free water, bound water and total water (i.e. free water+bound water) volumes. (Reproduced from Crain's Petrophysical Handbook, September 2019, https://www.spec2000.net/01-rockfluidmodel.htm) click to enlarge